Dashboards
The following dashboards provide the status of the MEG systems mainly
the QD Helium recovery system
the MEG-KIT system
the MEG-OPM system
the Vpixx devices system
The dashboard are updated weekly to show any incident or problem.
QD Helium Recovery Dashboard
MEG-KIT system status dashboard
MEG-OPM system status dashboard
Vpixx devices system status dashboard
Data Quality Dashboards
An MEG signal is a measurement of a very small magnetic field, in the order of 100 fT, where femtotesla \(1fT = 10^{-15} T\) and picotesla \(1pT = 10^{-12} T\).
EEG scalp signals are about 50 to 100 \(\mu\text{V}\)
Note
The dashboards are automatically updated every day at 10:00 am UAE time check the github actions for more information
Data Quality metrics
The metrics, defined in the table below, will serve as basis to asess the quality of empty-room data acquired from either MEG-KIT or MEG-OPM systems. The SNR (Signal to Noise Ratio) is a measure that can be qualitatively evaluated given the measurements of the different metrics. Poor SNR, can have multiple reasons: new unindentified recurrent noise source, defect in the equipment, specific event causing noise that is usually absent. Poor SNR can lead to experiments needing more number of trials, or artifact removal analysis.
Metric |
Formula |
Description |
Threshold |
Label |
|---|---|---|---|---|
RMS noise per sensor |
\(\mathrm{RMS}_c=\sqrt{\frac{1}{N}\sum_t x_c(t)^2}\) |
Root mean square of each sensor signal over the analysis window (10 s to 60 s), in femtotesla. Computed per channel; the dashboard reports the median and maximum across sensors and renders the per sensor values as a topography map. |
KIT median below 1000 fT and OPM median below 5000 fT |
RMS Median (fT) |
Noise floor (PSD) |
\(\sqrt{\overline{\mathrm{PSD}(f)}}\) over 5 to 7 Hz |
Square root of the Welch power spectral density averaged over a quiet band (5 to 7 Hz), in femtotesla per root hertz. This is the conventional empty-room noise figure and is computed per sensor. |
KIT median below 30 fT/sqrtHz and OPM median below 60 fT/sqrtHz |
Noise Floor Median (fT/sqrtHz) |
Line noise (50 Hz) |
\(\sqrt{\mathrm{PSD}(50)}\) |
Amplitude of the power spectral density at the mains frequency (50 Hz in the UAE), per sensor. Tracks powerline and environmental interference. |
Monitored without a hard threshold |
Line Noise Median (fT) |
Average |
\(A=\frac{1}{NT}\sum_{c,t} x_c(t)\) |
Mean of the signal across all sensors and time samples, in femtotesla. Retained for continuity with the earlier dashboards. |
Reference only |
Average (fT) |
Variance |
\(\mathrm{Var}=\frac{1}{NT}\sum_{c,t}(x_c(t)-A)^2\) |
Variance of the signal across all sensors and time. Retained for continuity with the earlier dashboards. |
Reference only |
Variance |
Maximum |
\(\max_{c,t} x_c(t)\) |
Largest single sample across all sensors and time, in femtotesla. Sensitive to transient artifacts. |
Reference only |
Maximum (fT) |
KIT Data Quality Dashboard
This dashboard monitors the quality of the data generated from the KIT-MEG system.
Empty room data is recorded from the KIT system regularly. The dataset on NYU Box is BIDS valid,
so each recording lives under sub-emptyroom/ses-YYYYMMDD/meg/ and is identified by the BIDS
acq-kit entity. For every recording the metrics described above are computed per sensor and
summarised across sensors. The results are refreshed automatically by the empty-room dashboard
GitHub Action and displayed below.
Latest recordings
Date |
Run |
Status |
RMS Median (fT) |
Noise Floor Median (fT/sqrtHz) |
Line Noise Median (fT) |
N Channels |
Details |
|---|---|---|---|---|---|---|---|
2024-10-08 |
2 |
🔴 Above thresholds |
5566.0 |
552.4 |
15.6 |
207 |
Nothing added yet |
2024-07-01 |
2 |
🟢 Within thresholds |
157.9 |
9.9 |
9.9 |
207 |
Nothing added yet |
2024-07-01 |
3 |
🟢 Within thresholds |
125.0 |
7.9 |
9.0 |
207 |
Nothing added yet |
Sensor noise topography
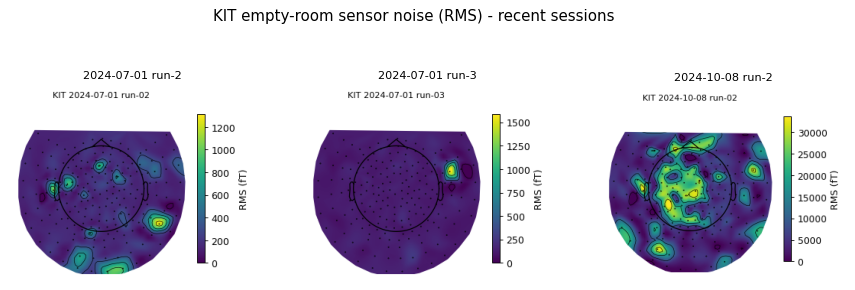
Per sensor RMS noise for the most recent sessions, projected onto the KIT sensor layout. A localised bright spot points to a noisy or faulty sensor, while a whole map shifting to brighter colours points to a noisy session.
Noise per sensor across sessions
The heatmap below shows the RMS noise of every sensor (rows) across all sessions (columns). A bright horizontal band identifies a sensor that is consistently noisy, while a bright vertical band identifies a noisy session.
Amplitude spectrum
KIT amplitude spectrum (most recent session)
Metrics over time
KIT median sensor RMS over time
KIT median noise floor over time
KIT line noise (50 Hz) over time
KIT average, variance and maximum over time (legacy metrics)
Perspectives on Data Quality dashboards
Implemented:
Per sensor metrics with sensor topography maps and a sensor by session heatmap, so faulty sensors and channel based issues are now visible.
Incremental tracking: a recording already present in the metrics CSV is skipped, so files are not redownloaded or recomputed unless a force flag is set.
The metrics CSV is updated per recording as each file is processed, not only at the end.
The analysis window is cropped to bound memory use.
Generation runs in a dedicated GitHub Action that commits the artifacts, rather than during the docs build.
Still open:
Check the lab manual to refine the metrics and thresholds (the current thresholds are provisional starting points).
Whiten the data to compute a noise covariance and a whitened noise figure.
Trigger the dashboard refresh on dataset changes (a file added on Box) rather than only on a daily schedule.
Documentation for dashboards
This section is a documentation guide targeted to users who would like to understand the current dashboards and some technical details regarding their generation. The dashboards are meant to monitor the status of the systems and the quality of the data by measuring noise levels in empty-room data while providing informative labels, for quick access and over all numerical values in a simple format. It has graphs showing the computation of different metrics (e.g., average and variance) of each empty-room data file, as well as a table listing the current state of each empty-room data dataset. The state indicates whether or not the dataset is within the “good” noise thresholds for each metric.
1. The following use cases are enabled by the dashboards:
Easily monitor the status of the systems using the table and track periods of time where incidents had happened
Get a summary of several measurements of metrics that evaluates the quality of data
Track down in history any data-quality issues when an experiment has been performed on a specific day
1. The source of this data is empty-room data hosted on the NYU-BOX data drive.
1. Overview of the table: the used data quality metrics are present in docs/source/data/noise_metrics.csv
File Details Column Name
Description
Obtained
Status
Gives the status of the given file’s average if it’s above or within the threshold. The status is indicated by a color: green for safe, red for above the threshold. The threshold is defined as below 3 fT.
Calculates the average of the signal over time and compares it to the threshold.
File Name
It is a combination of the time and the name of the file, separated by a ‘_’.
Obtained from the metadata available in the NYU-DATA box.
Average
Calculates the average of the signal over time.
Calculated by the simple functions defining the average function in Python.
Variance
Calculates the variance of the signal over time.
Calculated by the simple functions defining the variance function in Python.
Date
The date is defined as: format=”%d-%m-%y %H:%M:%S”.
Obtained from the metadata of the ‘last-modified’ field.
Details
Describes the details of the day and/or experiment that might explain the results obtained in the file.
Added by the user, default is “Nothing added yet”.
- 1. Future directions and perspectives:
build a database to host the data instead of having them as files
identify other metrics to be added to the existing list
get system status values by executing automated system tests
Dashboard Generation Developer Guide
Overview
The empty-room data quality dashboards are generated from the BIDS empty-room dataset hosted on
NYU Box. The scripts live under docs/source/scripts/dashboard-generating-scripts and are run by
the Empty-room Data Quality Dashboard GitHub Action (.github/workflows/empty-room-dashboard.yml),
not during the ReadTheDocs build. The Action downloads the data from Box, computes the metrics,
regenerates the figures and commits the resulting CSV, HTML and PNG files into the repository.
ReadTheDocs then simply renders those committed static files, which keeps the docs build fast and
prevents a Box or network problem from breaking the build.
The stack being used comprises:
data source: NYU Box (BIDS empty-room dataset)
compute: MNE, NumPy, SciPy, pandas
figures: Plotly (interactive HTML) and Matplotlib (sensor-topography PNG)
automation: GitHub Actions
rendering: Sphinx on ReadTheDocs
The scripts are:
config.pyall paths, Box folder identifiers, the per system definitions (acq entity, file extension, thresholds, output CSV paths) and the analysis parameters (window, PSD settings, line frequency).
paths are anchored to the file location, so the scripts run the same from the repository root, from
docs/sourceor from the Action.
utilities.pyauthenticates to Box from a single JWT settings JSON (
BOX_CLIENT_SDK_CONFIG);walks the dataset recursively (
sub-emptyroom/ses-*/meg) and classifies recordings by the BIDSacqentity (acq-kitgives.con,acq-opmgives.fif);computes per sensor RMS, PSD noise floor and line-noise, plus the summary average, variance and maximum, and writes the per recording and per sensor CSVs;
renders the sensor-topography maps, the sensor by session heatmap, the amplitude spectrum and the metric time-series figures.
update_data_quality_dashboards.pythe entry point. Run it with no arguments for a Box run, or with
--local-dirto process a local BIDS tree for testing (no Box credentials needed).--systems kit,opmselects systems.
generate_system_status_dashboards.pybuilds the system status tables (KIT, OPM, QD helium, Vpixx) from the status CSVs under
docs/source/data/system-status-dashboards.
Authentication
Authentication uses a single Box JWT settings JSON, the same secret used by the box-dataset-info
workflow. In CI it is provided as the BOX_CLIENT_SDK_CONFIG environment variable; for a manual run
you can place the same JSON in box_config.json next to the scripts (this file must not be committed).
import json, os
from boxsdk import Client, JWTAuth

settings = json.loads(os.environ["BOX_CLIENT_SDK_CONFIG"])
client = Client(JWTAuth.from_settings_dictionary(settings))
The folder that contains sub-emptyroom is resolved either from BOX_EMPTYROOM_FOLDER_ID (a direct
folder id) or by walking BOX_EMPTYROOM_RELPATH from BOX_MEG_DATA_PARENT_FOLDER_ID.
Running locally
pip install "boxsdk[jwt]" mne plotly pandas numpy scipy matplotlib

cd docs/source/scripts/dashboard-generating-scripts

# Offline test against a local BIDS tree (no Box needed):
python update_data_quality_dashboards.py --local-dir /path/to/empty-room --systems kit

# Full Box run (requires BOX_CLIENT_SDK_CONFIG):
python update_data_quality_dashboards.py --systems kit,opm
Outputs
docs/source/data/data-quality-dashboards/<system>-empty-room-metrics.csv: one row per recording.docs/source/data/data-quality-dashboards/<system>-per-channel-metrics.csv: one row per sensor per recording.docs/source/data/data-quality-dashboards/<system>-empty-room-metrics-display.csv: trimmed table rendered on this page.docs/source/_static/2-data-quality-dashboards/<system>_*.html: interactive figures.docs/source/_static/2-data-quality-dashboards/<system>_topomap_recent.png: sensor-topography maps.
Adding or changing a metric
Add the computation in compute_metrics in utilities.py, add the column to METRIC_COLUMNS (and
to DISPLAY_COLUMNS if it should appear in the table), document it in
docs/source/data/data-quality-dashboards/noise_metrics.csv, and add a figure builder if a plot is wanted.