Data Quality Dashboards
An MEG signal is a measurement of a very small magnetic field, in the order of 100 fT, where femtotesla \(1fT = 10^{-15} T\) and picotesla \(1pT = 10^{-12} T\). EEG scalp signals are about 50 to 100 \(\mu\text{V}\). Because the signals of interest are this small, the noise level of the empty magnetically shielded room is the baseline that decides how well brain activity can be measured. These dashboards track that baseline over time.
Note
The empty-room recordings are processed automatically every day at 09:00 UAE
time by the Empty-room Data Quality Dashboard GitHub Action; the website
rebuilds one hour later. If a plot looks stale, check that workflow’s last
run in the repository’s Actions tab.
Data Quality metrics
The metrics, defined in the table below, serve as the basis to assess the quality of empty-room data acquired from either the MEG-KIT or MEG-OPM system. The SNR (Signal to Noise Ratio) of an experiment can be qualitatively evaluated from these metrics: poor values can point to a new unidentified recurrent noise source, a defect in the equipment, or a one-off event. Poor noise conditions translate into experiments needing more trials, or heavier artifact removal during analysis.
Metric |
Formula |
Description |
Threshold |
Label |
|---|---|---|---|---|
RMS noise per sensor |
\(\mathrm{RMS}_c=\sqrt{\frac{1}{N}\sum_t x_c(t)^2}\) |
Root mean square of each sensor signal over the analysis window (10 s to 60 s), in femtotesla. Computed per channel; the dashboard reports the median and maximum across sensors and renders the per sensor values as a topography map. |
KIT median below 1000 fT and OPM median below 5000 fT |
RMS Median (fT) |
Noise floor (PSD) |
\(\sqrt{\overline{\mathrm{PSD}(f)}}\) over 5 to 7 Hz |
Square root of the Welch power spectral density averaged over a quiet band (5 to 7 Hz), in femtotesla per root hertz. This is the conventional empty-room noise figure and is computed per sensor. |
KIT median below 30 fT/sqrtHz and OPM median below 60 fT/sqrtHz |
Noise Floor Median (fT/sqrtHz) |
Line noise (50 Hz) |
\(\sqrt{\mathrm{PSD}(50)}\) |
Amplitude of the power spectral density at the mains frequency (50 Hz in the UAE), per sensor. Tracks powerline and environmental interference. |
Monitored without a hard threshold |
Line Noise Median (fT) |
Average |
\(A=\frac{1}{NT}\sum_{c,t} x_c(t)\) |
Mean of the signal across all sensors and time samples, in femtotesla. Retained for continuity with the earlier dashboards. |
Reference only |
Average (fT) |
Variance |
\(\mathrm{Var}=\frac{1}{NT}\sum_{c,t}(x_c(t)-A)^2\) |
Variance of the signal across all sensors and time. Retained for continuity with the earlier dashboards. |
Reference only |
Variance |
Maximum |
\(\max_{c,t} x_c(t)\) |
Largest single sample across all sensors and time, in femtotesla. Sensitive to transient artifacts. |
Reference only |
Maximum (fT) |
KIT Data Quality Dashboard
This dashboard monitors the quality of the data generated from the KIT-MEG
system. Empty room data is recorded from the KIT system regularly. The dataset
on NYU Box is BIDS valid, so each recording lives under
sub-emptyroom/ses-YYYYMMDD/meg/ and is identified by the BIDS acq-kit
entity. For every recording the metrics described above are computed per
sensor and summarised across sensors.
Latest recordings
How to read this table: one row per recording, most recent first. The table shows the latest recordings; expand the dropdown below it for the complete history.
Status compares the recording against the provisional thresholds: it is green (within thresholds) when the median sensor RMS is at or below 1000 fT and the median noise floor is at or below 30 fT per sqrt(Hz); it is red (above thresholds) otherwise. A red row means the room was noisier than the acceptance level at that time, so check the topography and spectrum below to find out why.
RMS Median (fT) is the median over sensors of each sensor’s root mean square amplitude in the analysis window: the overall noise magnitude.
Noise Floor Median (fT/sqrtHz) is the median over sensors of the power spectral density in the 5 to 7 Hz band: the broadband floor, away from mains and drift.
Line Noise Median (fT) is the median amplitude at 50 Hz, the UAE mains frequency: how much electrical interference leaks into the room.
Run distinguishes multiple recordings made in the same session.
Details is a free text field the team can fill to explain a result (for example, construction work that day).
Date |
Run |
Status |
RMS Median (fT) |
Noise Floor Median (fT/sqrtHz) |
Line Noise Median (fT) |
N Channels |
Details |
|---|---|---|---|---|---|---|---|
2024-10-23 |
1 |
🟢 Within thresholds |
583.8 |
8.5 |
11.3 |
207 |
|
2024-10-19 |
1 |
🟢 Within thresholds |
217.7 |
8.3 |
12.6 |
207 |
|
2024-10-11 |
1 |
🟢 Within thresholds |
693.3 |
9.5 |
8.8 |
207 |
|
2024-10-09 |
2 |
🟢 Within thresholds |
215.2 |
8.6 |
6.9 |
207 |
|
2024-10-09 |
1 |
🟢 Within thresholds |
123.3 |
8.5 |
6.8 |
207 |
|
2024-10-08 |
2 |
🔴 Above thresholds |
5566.0 |
552.4 |
15.6 |
207 |
|
2024-10-08 |
1 |
🟢 Within thresholds |
552.7 |
9.5 |
7.0 |
207 |
|
2024-10-07 |
1 |
🟢 Within thresholds |
124.6 |
8.9 |
7.7 |
207 |
Full recording history (most recent first)
Date |
Run |
Status |
RMS Median (fT) |
Noise Floor Median (fT/sqrtHz) |
Line Noise Median (fT) |
N Channels |
Details |
|---|---|---|---|---|---|---|---|
2024-10-23 |
1 |
🟢 Within thresholds |
583.8 |
8.5 |
11.3 |
207 |
|
2024-10-19 |
1 |
🟢 Within thresholds |
217.7 |
8.3 |
12.6 |
207 |
|
2024-10-11 |
1 |
🟢 Within thresholds |
693.3 |
9.5 |
8.8 |
207 |
|
2024-10-09 |
2 |
🟢 Within thresholds |
215.2 |
8.6 |
6.9 |
207 |
|
2024-10-09 |
1 |
🟢 Within thresholds |
123.3 |
8.5 |
6.8 |
207 |
|
2024-10-08 |
2 |
🔴 Above thresholds |
5566.0 |
552.4 |
15.6 |
207 |
|
2024-10-08 |
1 |
🟢 Within thresholds |
552.7 |
9.5 |
7.0 |
207 |
|
2024-10-07 |
1 |
🟢 Within thresholds |
124.6 |
8.9 |
7.7 |
207 |
|
2024-10-04 |
1 |
🟢 Within thresholds |
238.6 |
8.8 |
6.8 |
207 |
|
2024-10-03 |
1 |
🟢 Within thresholds |
329.4 |
8.9 |
6.7 |
207 |
|
2024-09-29 |
1 |
🟢 Within thresholds |
152.9 |
9.1 |
8.4 |
207 |
|
2024-09-23 |
2 |
🟢 Within thresholds |
416.8 |
9.4 |
7.8 |
207 |
|
2024-09-23 |
1 |
🟢 Within thresholds |
150.4 |
9.0 |
8.1 |
207 |
|
2024-09-20 |
1 |
🟢 Within thresholds |
258.4 |
9.8 |
10.5 |
207 |
|
2024-09-18 |
1 |
🟢 Within thresholds |
319.7 |
9.0 |
8.1 |
207 |
|
2024-09-16 |
1 |
🟢 Within thresholds |
199.8 |
8.9 |
8.3 |
207 |
|
2024-07-01 |
3 |
🟢 Within thresholds |
125.0 |
7.9 |
9.0 |
207 |
|
2024-07-01 |
2 |
🟢 Within thresholds |
157.9 |
9.9 |
9.9 |
207 |
|
2024-07-01 |
1 |
🟢 Within thresholds |
357.0 |
8.3 |
8.5 |
207 |
|
2024-06-28 |
12 |
🔴 Above thresholds |
1713.0 |
7.7 |
7.5 |
207 |
|
2024-06-28 |
11 |
🔴 Above thresholds |
1752.0 |
7.9 |
7.5 |
207 |
|
2024-06-28 |
10 |
🔴 Above thresholds |
1770.0 |
7.9 |
9.0 |
207 |
|
2024-06-28 |
9 |
🔴 Above thresholds |
1685.9 |
9.4 |
9.5 |
207 |
|
2024-06-28 |
8 |
🔴 Above thresholds |
1720.6 |
9.1 |
9.0 |
207 |
|
2024-06-28 |
7 |
🔴 Above thresholds |
1743.6 |
8.2 |
8.2 |
207 |
|
2024-06-28 |
6 |
🔴 Above thresholds |
1737.3 |
8.2 |
8.9 |
207 |
|
2024-06-28 |
5 |
🔴 Above thresholds |
1713.2 |
8.2 |
8.3 |
207 |
|
2024-06-28 |
4 |
🔴 Above thresholds |
1709.0 |
7.9 |
8.4 |
207 |
|
2024-06-28 |
3 |
🔴 Above thresholds |
1695.6 |
7.6 |
8.6 |
207 |
|
2024-06-28 |
2 |
🔴 Above thresholds |
1693.7 |
8.1 |
8.3 |
207 |
|
2024-06-28 |
1 |
🔴 Above thresholds |
1894.7 |
9.0 |
9.0 |
207 |
|
2024-06-26 |
3 |
🔴 Above thresholds |
1731.9 |
8.2 |
9.7 |
207 |
|
2024-06-26 |
2 |
🔴 Above thresholds |
1653.6 |
8.3 |
9.0 |
207 |
|
2024-06-26 |
1 |
🔴 Above thresholds |
1679.8 |
8.9 |
15.2 |
207 |
|
2024-04-19 |
1 |
🔴 Above thresholds |
1732.7 |
8.7 |
6.8 |
207 |
|
2024-04-15 |
2 |
🔴 Above thresholds |
1801.1 |
8.3 |
6.2 |
207 |
|
2024-04-15 |
1 |
🔴 Above thresholds |
1987.0 |
9.5 |
6.5 |
207 |
|
2024-02-21 |
1 |
🟢 Within thresholds |
403.8 |
9.2 |
8.3 |
207 |
|
2023-02-03 |
1 |
🟢 Within thresholds |
327.5 |
9.1 |
12.2 |
207 |
|
2023-02-02 |
1 |
🟢 Within thresholds |
515.3 |
9.6 |
12.7 |
207 |
|
2020-12-06 |
1 |
🟢 Within thresholds |
93.6 |
7.6 |
16.9 |
208 |
|
2018-12-07 |
1 |
🟢 Within thresholds |
97.8 |
7.7 |
13.2 |
208 |
|
2017-08-09 |
1 |
🟢 Within thresholds |
246.4 |
7.7 |
10.8 |
208 |
|
2013-12-25 |
1 |
🟢 Within thresholds |
142.2 |
8.0 |
16.0 |
208 |
|
2013-12-11 |
2 |
🟢 Within thresholds |
82.1 |
7.9 |
12.2 |
207 |
|
2013-12-11 |
1 |
🔴 Above thresholds |
1187.4 |
7.6 |
46.4 |
208 |
|
2013-08-14 |
1 |
🟢 Within thresholds |
187.0 |
8.3 |
28.3 |
208 |
Sensor noise topography
How to read these maps: each disc shows the per sensor RMS noise of one recording, projected onto the KIT sensor layout viewed from above (nose at the top). A localised bright spot points to a noisy or faulty individual sensor; a whole map shifting to brighter colours points to a noisy session.
Warning
Each map has its own colour scale. Always read the colourbar maximum before comparing two maps: a map that looks uniformly dark but whose scale tops at 30000 fT is far noisier than a bright-looking map whose scale tops at 1500 fT.
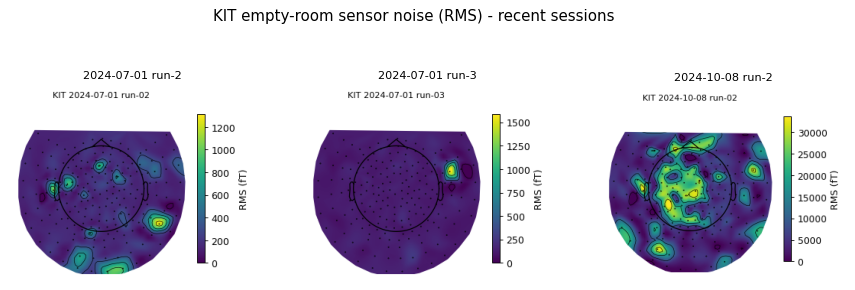
The map below is the interactive version of the same recent recordings. Pick a
recording in the dropdown, then hover any sensor dot to read the sensor name
(for example MEG 041) together with its RMS, noise floor and 50 Hz line
noise. Use it to identify exactly which sensor causes a hotspot seen in the
static maps above.
Noise per sensor across sessions
How to read this heatmap: rows are sensors, columns are sessions, colour is RMS noise. A bright horizontal band identifies a sensor that is consistently noisy across sessions (a sensor problem: it should be flagged to the MEG team). A bright vertical band identifies a single noisy session (an environment problem that day). Hover any cell for the exact sensor, session and value.
Amplitude spectrum
How to read the spectrum: the median amplitude across sensors of the most recent recording, per frequency. Expect a smooth floor with a rise at low frequencies (slow drifts, breathing of the building) and a sharp peak at 50 Hz with harmonics at 100 and 150 Hz (mains interference). New peaks at other frequencies usually identify a specific device switched on near the MSR; noting the frequency is the fastest way to track down the culprit.
KIT amplitude spectrum (most recent session)
Metrics over time
How to read the time series: each point is one recording, so these plots show the trend of the room’s noise across months. A single outlier usually has a one-off explanation (check the Details column of the table above); a sustained upward drift is the signal to investigate the room, the electronics or the helium system before experiments degrade.
KIT median sensor RMS over time
KIT median noise floor over time
KIT line noise (50 Hz) over time
KIT average, variance and maximum over time (legacy metrics)
These three raw statistics of the signal are kept for continuity with the original dashboards; the RMS, noise floor and line noise metrics above are the ones used for the acceptance thresholds.
Perspectives on Data Quality dashboards
Implemented:
Per sensor metrics with sensor topography maps and a sensor by session heatmap, so faulty sensors and channel based issues are now visible.
Incremental tracking: a recording already present in the metrics CSV is skipped, so files are not redownloaded or recomputed unless a force flag is set.
The metrics CSV is updated per recording as each file is processed, not only at the end.
The analysis window is cropped to bound memory use.
Generation runs in a dedicated GitHub Action that commits the artifacts, rather than during the docs build.
Still open:
Check the lab manual to refine the metrics and thresholds (the current thresholds are provisional starting points).
Whiten the data to compute a noise covariance and a whitened noise figure.
Trigger the dashboard refresh on dataset changes (a file added on Box) rather than only on a daily schedule.
Populate the OPM data quality dashboard (a single OPM empty-room recording exists on Box so far).
The OPM interactive topomap appears automatically once the next OPM recording is processed (it needs the stored sensor positions file; KIT already works today through its builtin layout).