FieldTrip / MATLAB: Photodiode trigger-display lag pipeline
Lead authors: Gayathri Satheesh gs2750@nyu.edu, Hadi Zaatiti hadi.zaatiti@nyu.edu
MATLAB / FieldTrip version of the photodiode timing analysis. It measures the delay between the MEG trigger and the actual display on the stimulus monitor and on the PROPixx projector. The projector is the ground truth for when the participant sees the stimulus. Rise-only (falling edges ignored).
The experiment is described on the Photodiode experiment page. The Python / MNE version is here.
Contributing
If you would like to contribute to this MATLAB-based notebook see MATLAB Kernel Setup Instructions.
Importing data
The two recordings are hosted on NYU BOX; permissions are given upon request. Files: sub-photodiode_01.con, sub-photodiode_02.con.
MATLAB setup
FieldTrip installed and on the MATLAB path.
NYUAD custom functions from pipeline/field_trip_pipelines/matlab_functions.
The swapped-sensitivity design
KIT ch |
FieldTrip |
Sensitivity |
|
|
|---|---|---|---|---|
224 |
225 |
|
trigger |
trigger |
232 |
233 |
HIGH |
stimulus |
projector |
233 |
234 |
LOW |
projector |
stimulus |
Indexing note. FieldTrip is 1-indexed, so KIT channel k is
chanindx = k+1. The script below does not rely on that: it identifies the trigger (~2.6 V) and the two photodiodes (~5 V) by signal content, so the offset cannot cause a mix-up.
Step 1 - read the three channels via FieldTrip
Full script: photodiode_analysis.m.
[ ]:
hdr = ft_read_header('sub-photodiode_01.con');
fs  = hdr.Fs;
% probe a 30 s window and classify channels by peak-to-peak amplitude
p0 = round(60*fs); p1 = p0 + round(30*fs) - 1;
cand = 224:235;
d = ft_read_data('sub-photodiode_01.con','chanindx',cand,'begsample',p0,'endsample',p1);
p2p = max(d,[],2) - min(d,[],2);
trigIdx = cand(find(p2p>1.5 & p2p<4, 1));      % trigger  ~2.6 V
pd = sort(cand(p2p>4.5));                        % two photodiodes ~5 V
highIdx = pd(1);   % KIT 232 = HIGH sens
lowIdx  = pd(end); % KIT 233 = LOW sens
fprintf('trig=%d  HIGH=%d  LOW=%d\n', trigIdx, highIdx, lowIdx);
trig=225 HIGH=233 LOW=234
Step 2 - rise-only edge detection
Rising edges at 50 % of each channel’s [1, 99] percentile range, 0.5 s refractory. The projector on the high-sensitivity channel is a DLP pulse train, so its white block is morphologically closed (base-MATLAB movmax/movmin, no toolbox) before taking the block onset.
[ ]:
function idx = rise_edges(x, fs, frac, refr_s)
  lo = prctile(x,1); hi = prctile(x,99); thr = lo + frac*(hi-lo);
  above = x > thr;
  c = find(above(2:end) & ~above(1:end-1)) + 1;
  idx = debounce(c, fs, refr_s);
end

function idx = envelope_onsets(x, fs, frac, close_ms, refr_s)  % DLP pulse train
  lo = prctile(x,1); hi = prctile(x,99); thr = lo + frac*(hi-lo);
  hot = double(x > thr); w = round(close_ms/1000*fs);
  dil = movmax(hot,2*w+1) > 0.5;                 % dilation
  ero = movmin(double(dil),2*w+1) > 0.5;         % erosion => closing
  c = find(ero(2:end) & ~ero(1:end-1)) + 1;
  idx = debounce(c, fs, refr_s);
end
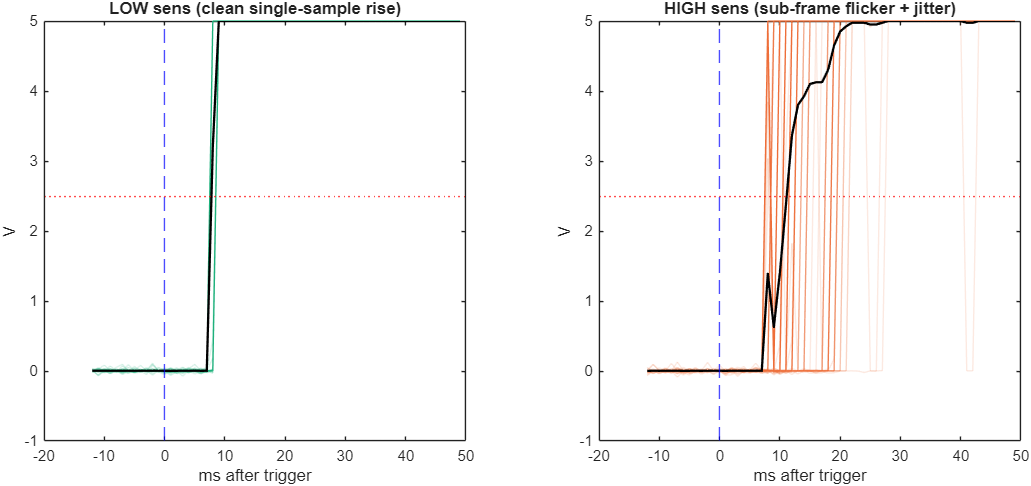
Onset overlays (200 trials aligned to the trigger). LOW sensitivity is a clean single-sample step; HIGH sensitivity is smeared by sub-frame flicker + jitter.
[ ]:
% see make_figure() in photodiode_analysis.m
Step 3 - the lags
Pair each trigger rising edge with the nearest screen rising edge and take the mean over 1000 trials, using the clean low-sensitivity channel for both screens.
[ ]:
tr01 = rise_edges(trig01, fs, 0.5, 0.5);
proj = pair_lag_ms(tr01, rise_edges(low01, fs, 0.5, 0.5), fs, 0.15);  % _01 low = projector
tr02 = rise_edges(trig02, fs, 0.5, 0.5);
stim = pair_lag_ms(tr02, rise_edges(low02, fs, 0.5, 0.5), fs, 0.15);  % _02 low = stimulus
fprintf('trigger -> stimulus : %+.3f ms (sd %.3f)\n', mean(stim), std(stim));
fprintf('trigger -> projector: %+.3f ms (sd %.3f)\n', mean(proj), std(proj));
fprintf('stimulus -> projector: %+.3f ms\n', mean(proj)-mean(stim));
trigger -> stimulus : +2.046 ms (sd 0.210)
trigger -> projector: +8.358 ms (sd 0.480)
stimulus -> projector: +6.312 ms
Headline
Lag (rising edge) |
Value |
SD |
n |
|---|---|---|---|
trigger 224 → stimulus monitor |
+2.05 ms |
0.21 |
1000 |
trigger 224 → projector |
+8.36 ms |
0.48 |
1000 |
stimulus monitor → projector |
+6.31 ms |
1000 |
These match the Python / MNE pipeline exactly (independent reader and codebase), and stimulus→projector = 6.31 ms is the same in every detection method.
Correcting MEG events
The trigger precedes the projector (what the participant sees) by a stable +8.36 ms. Shift trigger sample indices later by round(8.36/1000*fs) before defining trials, or use the Python apply_correction.py helper.